Development and Validation of Rear Impact Computer Simulation Model of an Adult Manual Transit Wheelchair with a Seated Occupant
Zdravko Salipur, BS, Gina Bertocci, PhD, PE
University of Louisville, Mechanical Engineering
ABSTRACT
It has been shown that WC19 wheelchairs that are crashworthy in frontal impact exhibit catastrophic failures in a rear impact collision and may not be able to protect the wheelchair occupant. Thus far only limited sled test and computer simulation data have been available to study rear impact wheelchair safety. Computer modeling can be used as a fast, economical, and comprehensive tool to gain critical knowledge regarding wheelchair integrity and occupant safety. This study describes the development and validation of a computer model simulating an adult wheelchair-seated occupant subjected to a rear impact event. The model can provide critical wheelchair loading information to wheelchair and tiedown manufacturers, resulting in safer wheelchair designs.
KEY WORDS
wheelchair transportation, computer simulation, transit wheelchair, rear impact, ANSI/RESNA WC19
BACKGROUND
The Americans with Disabilities Act (ADA) [1] was introduced in 1990 to assure that all people with disabilities are granted an equal opportunity to integrate into society. Therefore, ADA’s goal is to create a level playing field when it comes to transportation access, so that all individuals may pursue employment, education, and recreation. There are 2.3 million wheelchair users in the U.S. [2], and a substantial number may not be able to transfer from their wheelchair to a motor vehicle seat during transport. These wheelchair users should have the same level of transportation safety as persons using motor vehicle seats.
Wheelchairs are primarily designed to be mobile, and are often not intended to serve as motor vehicle seats, especially in a collision. Initial testing done at the University of Michigan Transportation Research Institute (UMTRI) found many catastrophic failures [3] when WC19 wheelchairs were subjected to a proposed ISO/TC 173 rear impact crash pulse. ANSI/RESNA WC19 wheelchairs have been designed to sustain frontal impact crashes, but because of differences in rear impact loading [4] and dynamics, they may not be able to sustain a rear impact crash. Rear impact collisions account for 43.5% of all motor vehicle crash related injuries [5] and 5.4% of fatalities [6]. Therefore it is important to further investigate effects of rear impact collisions on the occupant, wheelchair, and the wheelchair tiedown and occupant restraint system (WTORS). Sled testing is one method to perform this investigation, but has certain limitations. Sled test limitations include the ability to provide certain data such as wheelchair structure loading, time to perform a single test, and relatively high costs. Computer simulation is not associated with these limitations and can be an effective tool to supplement sled testing.
Computer simulation has been used previously to study wheelchair and seat loading during frontal impact conditions [7], [8], [9]. These studies used validated computer simulation models to investigate loading patterns imposed by frontal impact to aid in the design of crashworthy pediatric and adult wheelchairs. Rear impact models were also previously developed for an adult manual wheelchair as well as a surrogate wheelchair base (SWCB), but neither was validated [10], [11]. The development of a validated rear impact computer simulation model with a commercial, adult-occupied, manual wheelchair can serve as a valuable tool that may assist in the development of wheelchairs suitable for rear impact.
METHODOLOGY
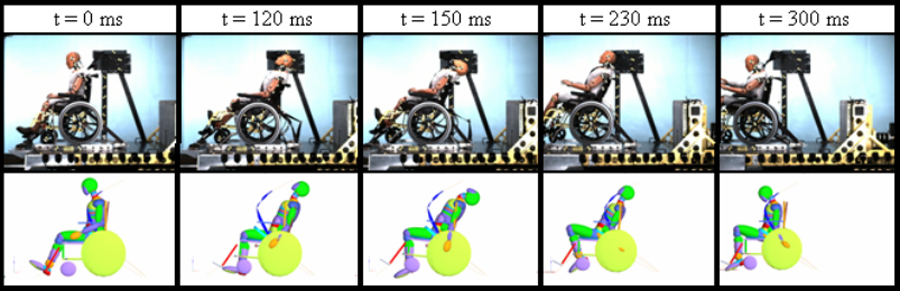 Figure 1. Frame sequence of typical rear impact test (top) and simulation model (bottom) (Click for larger view)
 Three identical, ANSI/RESNA WC19, reinforced, manual, folding, X-braced wheelchairs (25.1 kg) were subjected to a rear impact crash pulse at UMTRI. A 50th percentile Hybrid III anthropomorphic test device (ATD – 78.3 kg) represented the wheelchair-seated occupant, while the crash pulse (25.8 km/h, 14 g) was as described in the proposed ISO/TC 173 rear impact standard. The wheelchair was secured using surrogate 4-point strap-type tiedowns, while the ATD was restrained using a surrogate vehicle-mounted 3-point lap and shoulder belt system. Multiple views of the sled tests were captured using Kodak HG 2000 high speed digital cameras (1000 frames/sec). High contrast markers were placed on the wheelchair and ATD to track kinematic response, while all other signals were acquired and filtered in accordance with SAE J211 [12].
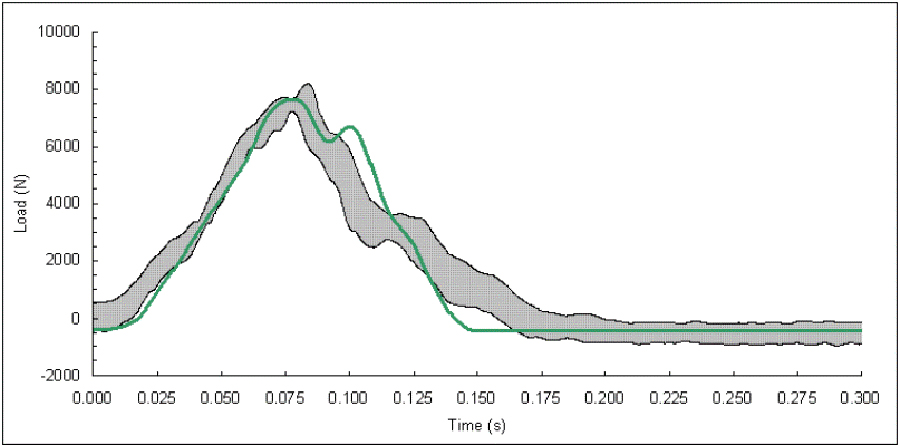 Figure 2. Front tiedown loading: model (green solid line) vs. sled test min-max corridor (shaded). (Click for larger view)
 The rear impact scenario above was reconstructed using MADYMOTM (Mathematical Dynamic Modeling) software, an advanced software engineering tool developed by TNO (Delft, Netherlands). MADYMO has combined capability of finite element and rigid body modeling, and is commonly used in the automotive industry for occupant safety investigation. MADYMO has also been previously used to develop a frontal impact model of a pediatric wheelchair and seated occupant [13].
The wheelchair frame, wheels, seat, and seatback were modeled using multi-body ellipsoids, while the validated ellipsoid ATD was imported from the TNO database. The 4 strap-type tiedowns were represented using belt segments, while the occupant restraints (lap and shoulder belt) were modeled using finite element belts.
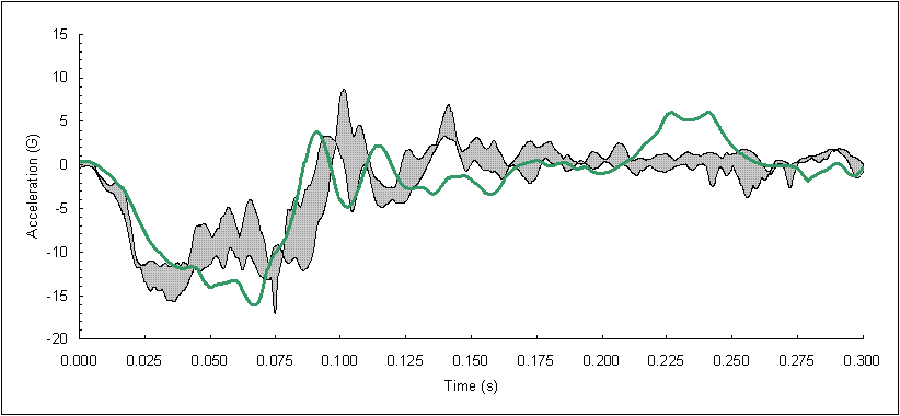 Figure 3. Wheelchair acceleration in direction of travel: model (green solid line) vs. sled test min-max corridor (shaded). (Click for larger view)
 Validation of the model ultimately involved matching the model outcome variables to those from the sled test results. The variables investigated in the model validation included (1) front tiedown loading, (2) wheelchair acceleration in the direction of travel (x), and (3) vertical wheelchair caster excursion. In an initial visual comparison, video from the sled tests and simulations were used to assess and compare the wheelchair and ATD kinematics. Secondly, a min-max corridor was established for all outcome variables using time history and video data from the three sled tests. The simulation output was then graphically over-laid onto the corridors for visual comparison. This visual comparison between the time histories was used as a primary means to determine model validity. Finally, five statistical tests were used to quantify and further test this validity between the average sled test and simulation signals. For front tiedown loading and vertical front caster excursion the entire signal time history (0-300 ms) was subjected to statistical testing, while the wheelchair acceleration time history was limited to the primary impact (0-125 ms) for the statistical analysis.
RESULTS
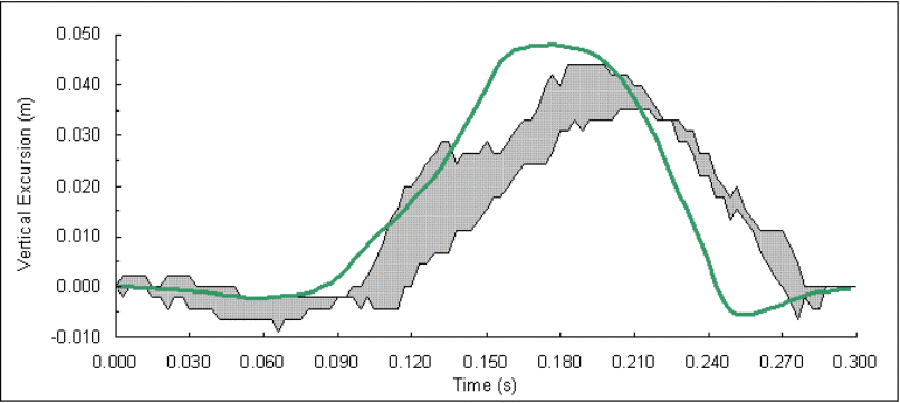 Figure 4. Front caster vertical excursion: model (green solid line) vs. sled test min-max corridor (shaded). (Click for larger view)
 Figure 1 shows a side view frame sequence for a typical rear impact test (top) and the computer model simulation (bottom). The sequence begins at t = 0 ms and ends at t = 300 ms. After the deceleration pulse begins, the ATD moves rearward against the seatback, as the front casters lift off the ground, and the wheelchair rotates slightly on the rear wheels. The ATD head excursion peaks around 150 ms, followed by the rebound, during which the ATD begins moving forward.
Figure 2 shows front tiedown loading predicted by the model over-laid onto the sled test corridor, while Figure 3 shows the simulated wheelchair acceleration vs. the wheelchair acceleration corridor from sled tests.
Figure 4 illustrates the model-predicted vertical excursion of the front caster in comparison with the corresponding sled test min-max corridor.
Table 1 shows the results from the statistical analyses of the simulation model vs. sled test signal comparisons. For the various outcome measures, 2 to 5 statistical test criteria were satisfied, depending upon individual outcome measures.
DISCUSSION
Figure 1 suggests initial agreement between the sled test and model simulation. Sled test and model-predicted ATD and wheelchair kinematics correspond throughout the entire impact event.
Model validity is further substantiated by the correspondence between time history curves for the sled tests and model for the three outcome variables. Figures 2-4 show that there is similarity based upon general curve shapes and peak values between the sled test and model outcome measures.
The various statistical tests used to test and quantify model validity were chosen because they address various aspects of signal (curve) comparison [14]. Combined together, the tests provide a quantitative indication of level of model validity for each outcome measure. As Table 1 suggests, some outcome measures may be considered more valid than others. For example, front tiedown loading is similar between the sled tests and model because it meets the criteria for all statistical tests.
The wheelchair acceleration signal used in the statistical analysis was limited to primary impact (0-125 ms) because this is the time period during in which the wheelchair is subjected to the highest accelerations and loads, and when most wheelchair failures occur. The wheelchair acceleration outcome measure meets 3 of 5 statistical test criteria. The model wheelchair acceleration peak is within 20% of the sled test peak wheelchair acceleration; but the criterion was not satisfied because the peak occurred outside the allowed time window (+/- 5ms). These differences may be due to simplification of the wheelchair in the model. The wheelchair was modeled with rigid bodies that were represented by ellipsoids, making the entire model more rudimentary than the actual wheelchair, which was constructed of nearly a hundred parts. The vertical caster excursion signal passed the least number of statistical test criteria; 2 of 5. This may be attributed to the fact that the average vertical caster excursion time history from the sled tests was attained using video motion tracking software, MaxTRAQ (Innovision Systems, Inc.), while the front tiedown load and wheelchair acceleration corridors were established using time history data measured directly with load cells and accelerometers. Not only was video data collected at a lower frequency rate than the loading and acceleration data, but the caster position had to be manually identified in each frame using high contrast markers. The caster position is susceptible to error since it was subjectively determined by the operator in each frame. At times the caster position was difficult to determine because the caster rotated about the vertical axis (into the screen) and the high contrast marker was not visible. This 3D motion of the caster made it difficult to determine its position in a 2D analysis. Despite the limitations, the peak caster excursion from the model is within 26% and 30 ms of the sled test caster excursion peak, so the model may still be a reasonable predictor of caster excursion.
Another limitation in the model is that the occupant response has not yet been validated. TNO’s database ATD, imported for use in the model, has only been validated in frontal impact [15]. Further investigation is needed to determine if the occupant response can be accurately predicted by this model.
It has been found that frontal impact crashworthy wheelchairs subjected to rear impact experience catastrophic failures [3]. This is due to the dynamics of a rear impact event, where the front tiedowns serve as the main means of securing the wheelchair, while the ATD moves rearward, loading the seatback. This model can provide much needed loading information to wheelchair and tiedown manufacturers, which may be crucial in the production of rear impact safe transit wheelchairs. Future work will include a parametric sensitivity analysis, which will examine the effect of wheelchair configuration on front tiedown and seatback loading.
CONCLUSION
This simulation model is considered a reasonable representation of a rear impact event as it relates to tiedown and wheelchair response. The model will aid in providing design guidelines for tiedown and wheelchair manufacturers so that rear impact crashworthy wheelchairs and securement systems can be introduced to the market place.
REFERENCES
- Americans with Disabilities Act (ADA) Accessibility Guidelines for Transportation Vehicles, Architectural and transportation Barriers Compliance Board (ATBCB), 36 CFR Part 1192 Federal Register, Vol. 56 No. 173, 1991.
- LaPlante, M. Demographics of Wheeled Mobility Device Users. Space Requirements for Wheeled Mobility Conference Proceedings, Center for Inclusive Design and Environmental Access, University of Buffalo, State University of New York, Buffalo, NY, October 2003.
- Manary, M.A., Bezaire, B.A., Bertocci, G.E., Salipur, Z., and Schneider, L.W. Crashworthiness of Forward-Facing Wheelchairs under Rear Impact Conditions. RESNA Conference Proceedings, Phoenix, AZ, June 2007.
- Salipur, Z., Bertocci, G.E., Manary, M.A., and Ritchie, N. Wheelchair Tiedown and Occupant Restraint System Loading Associated with an Adult Manual ANSI WC19 Transit Wheelchair with a Seated 50th percentile ATD Exposed to Rear Impact. RESNA Conference Proceedings, Phoenix, AZ, June 2007.
- Japan Traffic Safety Association, Traffic Greenpaper. 1997. p. 115-118.
- National Highway Transportation Safety Administration (NHTSA), 2005 Traffic Facts Overview. 2005.
- Bertocci, G.E., Hobson, D.A., and Digges, K.H., Development of Transportable Wheelchair Design Criteria Using Computer Crash Simulation. IEEE Transactions on Rehabilitation Engineering, 1996. 4(3): p. 10.
- Bertocci, G.E., Szobota, S., Hobson, D.A., and Digges, K., Computer Simulation and Sled Test Validation of a Powerbase Wheelchair and Occupant Subjected to Frontal Crash Conditions. IEEE Transactions on Rehabilitation Engineering, 1999. 7(2): p. 10.
- Ha, D., Bertocci, G., and Jategaonkar, R. Development of manual pediatric transit wheelchair design guidelines using computer simulation. RESNA Conference Proceedings, Atlanta, GA, June 2005.
- Manary, M.A. and Schneider, L.W. Wheelchair Seatback Loads and Deflections in Rear Impacts. RESNA Conference Proceedings, Orlando, FL, June 2007.
- Paskoff, G., Transportation of Wheelchair Users, An Assessment of Neck Injury Risk During Rear Collisions, Thesis for Master of Science in Biomedical Engineering, School Of Engineering and Applied Science, University of Virginia, 1995.
- Society of Automotive Engineers (SAE), Instrumentation For Impact Tests - SAE J211 Standard. 1988.
- Dong Ran Ha, G.B., Rohit Jategaonkar Development of manual pediatric transit wheelchair design guidelines using computer simulation. RESNA Conference Proceedings, Atlanta, GA, June 2005.
- Pipcorn, B. and Eriksson, M. A Method to Evaluate the Validity of Mathematical Models. MADYMO European User's Meeting Conference Proceedings, Brussels, Belguim, 2003.
- TNO, MADYMO Model Manual, Release 6.4. 2007, Delft, Netherlands.
ACKNOWLEDGEMENTS
This research was supported by a grant from the Paralyzed Veteran’s of America Spinal Cord Injury Research Foundation, Grant # 2422. The opinions expressed herein are those of the authors and do not necessarily represent those of the funding agency. The authors thank Miriam Manary, Nichole Ritchie, and the entire UMTRI staff for their assistance in conducting sled tests, as well as Susan Fuhrman, Angela Knight, and Raymond D’Souza for their aid during model development, troubleshooting, and validation.
Zdravko Salipur, BS, Injury Risk Assessment and Prevention (iRAP) Laboratory, University of Louisville, Instructional Building B – Room 110, 500 S. Preston St., Louisville, KY 40202, Tel: (502) 852-0279, Email: zsalipur@hotmail.com